KangaVault
KangaVault
KangaSys
Building Intelligence & Sustainability Platform · Australia

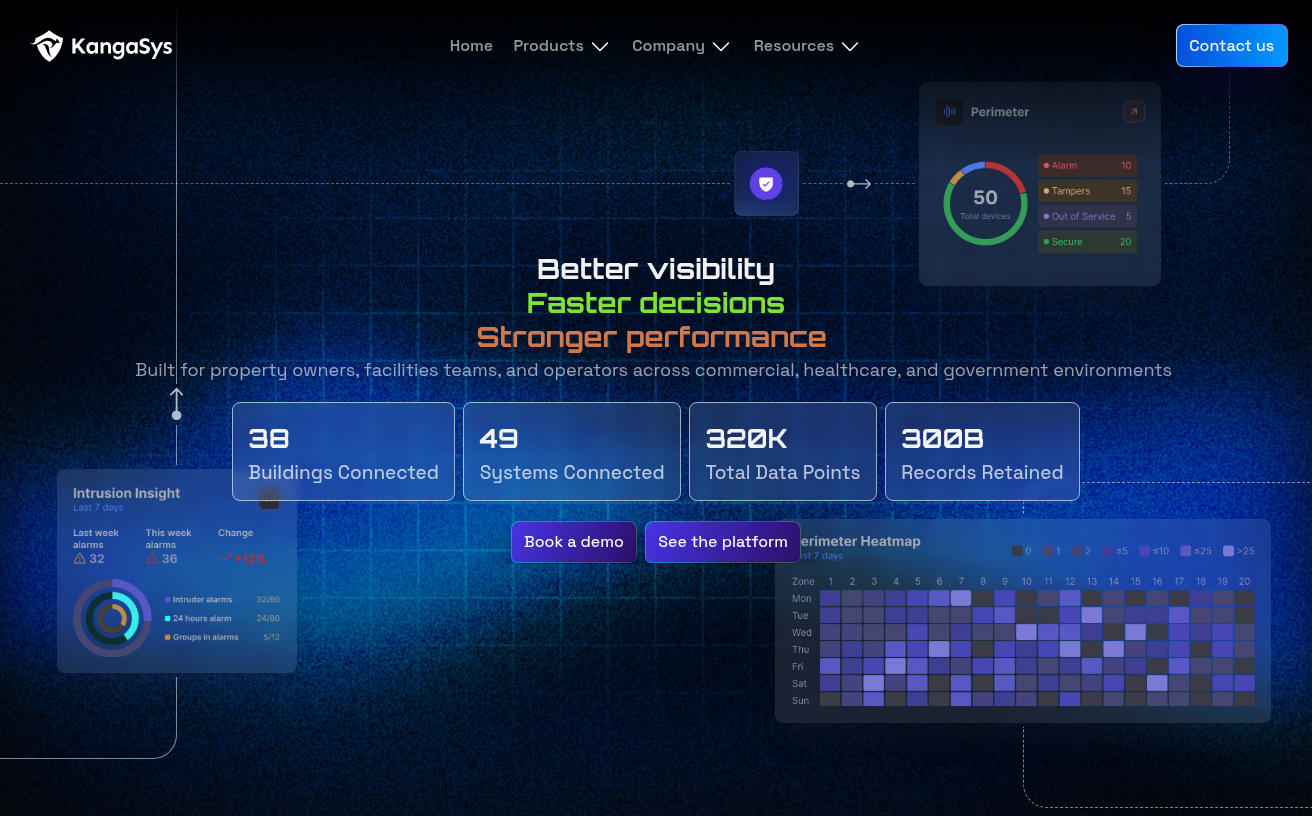
Making fragmented building-system data accessible for sustainability.
KangaSys
Building Intelligence & Sustainability Platform · Australia
Making fragmented building-system data accessible for sustainability.
How do you make a complex building intelligence platform usable for the people responsible for running a hotel?
Hotels and commercial buildings generate operational data across meters, sensors, floors, rooms, equipment, and people. But collecting that data is only part of the challenge. Teams need to configure the building, connect devices, manage records, understand operational conditions, and turn fragmented information into something they can act on.
KangaVault / KangaSys is a building intelligence and sustainability platform designed for an Australian context, bringing building infrastructure, energy consumption, occupancy, and operational information into a more connected experience.
My work focused on simplifying the configuration and management experience, particularly for users with different levels of technical expertise. This meant thinking beyond individual screens to understand how buildings, floors, meters, sub-meters, rooms, devices, and operational users relate to one another.
The goal was to make a technically complex system easier to configure, navigate, and maintain.
For facility and sustainability teams, understanding the building requires more than viewing a single energy-consumption figure. They need to understand where the data originates, which part of the building it represents, how it changes over time, and who is responsible for acting on it.
A building intelligence platform can help connect these operational layers.
Provide the context for locating equipment and consumption data.
Help associate energy usage with relevant parts of a property.
Provide operational observations, depending on the installed hardware.
Help identify the people associated with operational responsibilities.
Help teams maintain information about properties, equipment, and their associated users.
The UX challenge is to make these relationships understandable without requiring every user to understand the underlying technical architecture.
NABERS, the National Australian Built Environment Rating System, provides independent ratings of building performance. For hotels, it offers a framework to assess energy efficiency and water efficiency, alongside separate waste-verification and carbon-neutral certification pathways.
A NABERS hotel rating uses 12 months of operational data and compares the building’s performance against an industry benchmark. The energy rating is expressed on a six-star scale, with three stars representing average performance and six stars representing market-leading performance.
These are important reasons for reliable building data and usable monitoring tools. A software platform can support data collection, organisation, and analysis, but the official NABERS rating itself requires an accredited assessor and compliant evidence.
The product opportunityMake the building and its operational data easier to configure and understand, so teams can spend less effort navigating disconnected information and more effort improving performance.
A common assumption with operational software is that the dashboard is the main experience. In reality, its usefulness depends on the quality of everything that comes before it.
Before a hotel team can make sense of building information, the system needs a meaningful structure. Properties must be represented correctly. Floors and rooms need to be associated with the right building. Meters and other devices need to be mapped to the relevant locations or equipment. Operational records need to be maintained.
If these relationships are difficult to establish or understand, even a well-designed dashboard can become difficult to trust and use.
Users need to establish the building structure and configure the system before they can make effective use of the information it contains.
Technical users need to connect and configure sensors, meters, and endpoints, while non-technical users need to understand their status and identify when something requires attention.
Property information, employee records, and supervisor responsibilities need to be organised so that users can find the information relevant to their work.
Building and energy data needs to be presented with enough context for users to understand what it represents and what to investigate next.
These are not independent screens. They form a connected operational experience.
The exact hierarchy depends on the property’s infrastructure and the product’s supported configuration.
A building is easy to understand physically, but its digital representation can become complicated. Some users think in terms of floors and rooms; others think in terms of meters, endpoints, electrical circuits, or building systems.
The interface needs to support both ways of thinking.
Make the relationship between properties, buildings, floors, rooms, and devices visible. Users should understand where an item belongs and how it relates to the larger property.
Collect the information needed to establish the building first, then provide access to more advanced configuration when required.
When users create or edit a floor, room, meter, or device, clearly identify its parent building or area. This reduces the risk of associating data with the wrong location.
Buildings evolve. Equipment is replaced, rooms are repurposed, and monitoring requirements change. Configuration should support maintenance without forcing users to reconstruct the entire property.
Where the product supports it, communicate which setup steps are complete, which items remain unconfigured, and what needs attention before the system can be used effectively.
Treat building configuration as the creation of a reliable digital representation of a real-world property, not simply a form-filling exercise.
Connecting these components introduces a different level of complexity from managing ordinary business records.
Technical users may need to configure device identifiers, communication settings, or connection parameters. Operational users may only need to know which device belongs to a location, whether it is connected, and whether its data is available.
The UX needs to support both audiences without making every user navigate the same technical details.
A configured device is not necessarily connected, and a connected device is not necessarily providing usable data.
Give users a clear way to add a device and identify it within the building’s hierarchy.
Associate the device with the correct building, floor, room, meter, or equipment where applicable.
Distinguish between a device that has been configured, one that is connected, and one that is actively providing usable data. These states should not be treated as interchangeable.
Where connection failures or missing data occur, provide understandable status information and a clear next step rather than exposing only technical errors.
Support changes to device assignments and configurations as the physical building evolves.
For a networking or engineering user, configuration details may be necessary. For a floor supervisor, those same details may be unnecessary and confusing.
A better experience presents the information relevant to each user’s task while preserving access to deeper technical details for those who need them.
Make the technical state of a device understandable without requiring every user to understand the technology behind it.
In a hotel or commercial-building environment, users may need to maintain property details, building information, associated records, and the relationships between them.
The CRM or management component of the product should help users establish a dependable source of operational information rather than forcing them to reconstruct context across disconnected records.
Information becomes difficult to manage when similar records are duplicated, relationships are unclear, or users cannot easily identify which property, building, or team a record belongs to.
The challenge is to make records easy to locate, maintain, and associate with the correct operational context.
Treat record management as part of the operational system, not as a disconnected administrative module.
Employee records and floor-supervisor information introduce a people-management layer into the wider building intelligence experience. These records may help users understand who is associated with a property, who supervises a particular area, and where operational responsibilities sit.
The exact relationships depend on the product’s implemented functionality.
Employee information needs to be organised so that authorised users can find the right record and understand its relevance to the organisation or property.
Because employee records contain personal information, the interface should expose only the information necessary for each user’s responsibilities.
Floor supervisors occupy an important position between building operations and day-to-day activity. Their information needs to be accessible in the context of the floors or areas they oversee, where the product supports those associations.
If the system supports assigning supervisors to floors, the relationship should be explicit and easy to review. Users should not have to infer responsibility from disconnected employee and floor records.
The UX opportunityBy organising people and building information around meaningful relationships, the product can reduce the effort required to understand who is associated with a location and where relevant operational information can be found.
For hotel operators, the value of energy monitoring lies not simply in collecting readings, but in understanding consumption and identifying opportunities for improvement.
A well-structured monitoring experience should help users connect a reading to its source, location, time period, and relevant operational context.
Show consumption information with meaningful units, time periods, and building context.
Where metering supports it, help users compare consumption across buildings, floors, or areas.
Make missing, stale, or unavailable readings distinguishable from genuine zero consumption.
Where historical data is available, enable users to understand changes over time and investigate unusual patterns.
Help users identify where additional investigation may be necessary without implying that a dashboard alone can diagnose the underlying cause.
NABERS provides a standardised way to assess building performance using operational data and appropriate benchmarks. KangaVault / KangaSys can be positioned in this broader context as a building intelligence platform that helps organise and understand the operational information relevant to energy management.
The distinction matters: monitoring software can help teams collect, interpret, and act on building data, while an official NABERS rating involves its own methodology, evidence requirements, and accredited assessment process.
Give every important data point enough context to answer three questions:
Where did it come from?
What does it represent?
What should the user investigate next?
A technical user configuring meters or devices may need precise configuration information and a clear view of system relationships. A hotel operations user may be more interested in locating a floor, checking information, reviewing records, or understanding whether a device is functioning as expected.
An experience designed exclusively for technical users risks making routine tasks unnecessarily difficult for operational teams. An experience designed exclusively for non-technical users risks hiding the controls required to configure and maintain the system.
The goal is not to remove complexity from the underlying system. It is to present that complexity at the right level for the user and task.
Rather than treating onboarding, device configuration, and information management as isolated screens, the experience needed to reflect the relationships between them.
KangaVault / KangaSys represents a different side of enterprise UX from conventional SaaS dashboards. The experience has to connect the physical structure of a building with its data, devices, and operational users.
The core design challenge is relational: a meter belongs somewhere, a sensor represents something, a floor exists within a property, and a supervisor may be responsible for a specific area. When those relationships are difficult to understand, the entire system becomes harder to use.
Understanding how building entities and operational workflows connect.
Making technical setup manageable for different user groups.
Giving complex building data a clear and navigable structure.
Aligning the user experience with backend models and technical constraints.
Understanding why reliable building data matters to energy monitoring and performance improvement.
Good building intelligence starts before the dashboard. It starts with making the building, its devices, its data, and the people responsible for it understandable as one connected system.
That is the UX opportunity behind KangaVault / KangaSys: turning technical building infrastructure into an experience that people can configure, navigate, and use with confidence.
How the product is structured — the top-level areas and what lives inside each.
Low-fidelity layouts for the key screens, focused on structure and hierarchy before visual design.